Shorting the short-term volatility etn VXX may seem like a great idea when you look at the chart from quite a distance. Due to the contango in the volatility futures, the etn experiences quite some headwind most of the time and looses a little bit its value every day. This happens due to daily rebalancing, for more information please look into the prospect.
In an ideal world, if you hold it long enough, a profit generated by time decay in the futures and etn rebalancing is guaranteed, but in the short term, you'd have to go through some pretty heavy drawdowns. Just look back at the summer of 2011. I have been unfortunate (or foolish) enough to hold a short VXX position just before the VIX went up. I have almost blown my account by then: 80% drawdown in just a couple of days resulting in a threat of margin call by my broker. Margin call would mean cashing the loss. This is not a situation I'd ever like to be in again. I knew it would not be easy to keep head cool at all times, but experiencing the stress and pressure of the situation was something different. Luckily I knew how VXX tends to behave, so I did not panic, but switched side to XIV to avoid a margin call. The story ends well, 8 month later my portfolio was back at strength and I have learned a very valuable lesson.
To start with a word of warning here: do not trade volatility unless you know exactly how much risk you are taking.
Having said that, let's take a look at a strategy that minimizes some of the risks by shorting VXX only when it is appropriate.
Strategy thesis: VXX experiences most drag when the futures curve is in a steep contango. The futures curve is approximated by the VIX-VXV relationship. We will short VXX when VXV has an unusually high premium over VIX.
First, let's take a look at the VIX-VXV relationship:
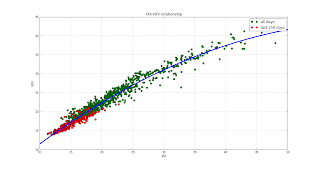
The chart above shows VIX-VXV data since January 2010. Data points from last year are shown in red.
I have chosen to use a quadratic fit between the two, approximating VXV = f(VIX) . The f(VIX) is plotted as a blue line.
The values above the line represent situation when the futures are in stronger than normal contango. Now I define a delta indicator, which is the deviation from the fit: delta = VXV-f(VIX).
Now let's take a look at the price of VXX along with delta:
 Above: price of VXX on log scale. Below: delta. Green markers indicat delta > 0 , red markers delta<0.
It is apparent that green areas correspond to a negative returns in the VXX.
Let's simulate a strategy with this these assumptions:

In an ideal world, if you hold it long enough, a profit generated by time decay in the futures and etn rebalancing is guaranteed, but in the short term, you'd have to go through some pretty heavy drawdowns. Just look back at the summer of 2011. I have been unfortunate (or foolish) enough to hold a short VXX position just before the VIX went up. I have almost blown my account by then: 80% drawdown in just a couple of days resulting in a threat of margin call by my broker. Margin call would mean cashing the loss. This is not a situation I'd ever like to be in again. I knew it would not be easy to keep head cool at all times, but experiencing the stress and pressure of the situation was something different. Luckily I knew how VXX tends to behave, so I did not panic, but switched side to XIV to avoid a margin call. The story ends well, 8 month later my portfolio was back at strength and I have learned a very valuable lesson.
To start with a word of warning here: do not trade volatility unless you know exactly how much risk you are taking.
Having said that, let's take a look at a strategy that minimizes some of the risks by shorting VXX only when it is appropriate.
Strategy thesis: VXX experiences most drag when the futures curve is in a steep contango. The futures curve is approximated by the VIX-VXV relationship. We will short VXX when VXV has an unusually high premium over VIX.
First, let's take a look at the VIX-VXV relationship:

The chart above shows VIX-VXV data since January 2010. Data points from last year are shown in red.
I have chosen to use a quadratic fit between the two, approximating VXV = f(VIX) . The f(VIX) is plotted as a blue line.
The values above the line represent situation when the futures are in stronger than normal contango. Now I define a delta indicator, which is the deviation from the fit: delta = VXV-f(VIX).
Now let's take a look at the price of VXX along with delta:

It is apparent that green areas correspond to a negative returns in the VXX.
Let's simulate a strategy with this these assumptions:
- Short VXX when delta > 0
- Constant capital ( bet on each day is 100$)
- No slippage or transaction costs
This strategy is compared with the one that trades short every day, but does not take delta into account.

The green line represents our VXX short strategy, blue line is the dumb one.
Metrics:
Metrics:
          Delta>0     Dumb
Sharpe:    1.9         1.2
Max DD:    33%         114% (!!!)
Sharpe of 1.9 for a simple end-of-day strategy is not bad at all in my opinion. But even more important is that the gut-wrenching drawdowns are largely avoided by paying attention to the forward futures curve.
Building this strategy step-by-step will be discussed during the coming Trading With Python course.
Building this strategy step-by-step will be discussed during the coming Trading With Python course.
This post is quite heavy to digest. How about splitting it into pieces? It would be great to get more details on your 2011 trades. You may show some charts with dots where you get in, out and switch from one ETN to another. That's a lively experience to share!
ReplyDeleteAlso, defining the underlying of VIX and VXV may explain better the relationship between the spread and the contango or backwardation, from a didactic point of view.
Your strategy is amazing and supplementary to Michael Stokes' blog (http://marketsci.wordpress.com/). My only critic is that you use the function VXV = f(VIX) in your backtest but the function is known only ex post. You may amend your process to walk-forward estimate the function f.
I love your posts and expect to read more in the near future. Congrats again!
This post only gives an overview of building and testing the strategy.I plan on explaining this step-by-step (including getting the data from CBOE and curve fitting) in the TradingWithPython course material.
DeleteRegarding VXV=f(VIX), I know (from previous testing) that the relationship is pretty stable through the years, so I am not afraid of look-ahead bias. The last 250 days are plotted in the first chart in red, just to make sure that the relationship is roughly the same as before.
Interesting idea, what sort of borrow costs have you encountered when shorting VXX? I would suspect that they are quite high for leveraged/volatility ETFs ?
ReplyDeleteThe borrowing costs are very reasonable (couple percent/year) given the yearly loss of value in VXX .
DeleteHey Jev, long time. I too have been messing with VXX and XIV although a lot less quantitative. Long XIV and long VXX calls (some long VXX puts that have worked out with mixed results). Looks like I'll have to re-familiarize myself with my TradingwithPython course.
ReplyDelete